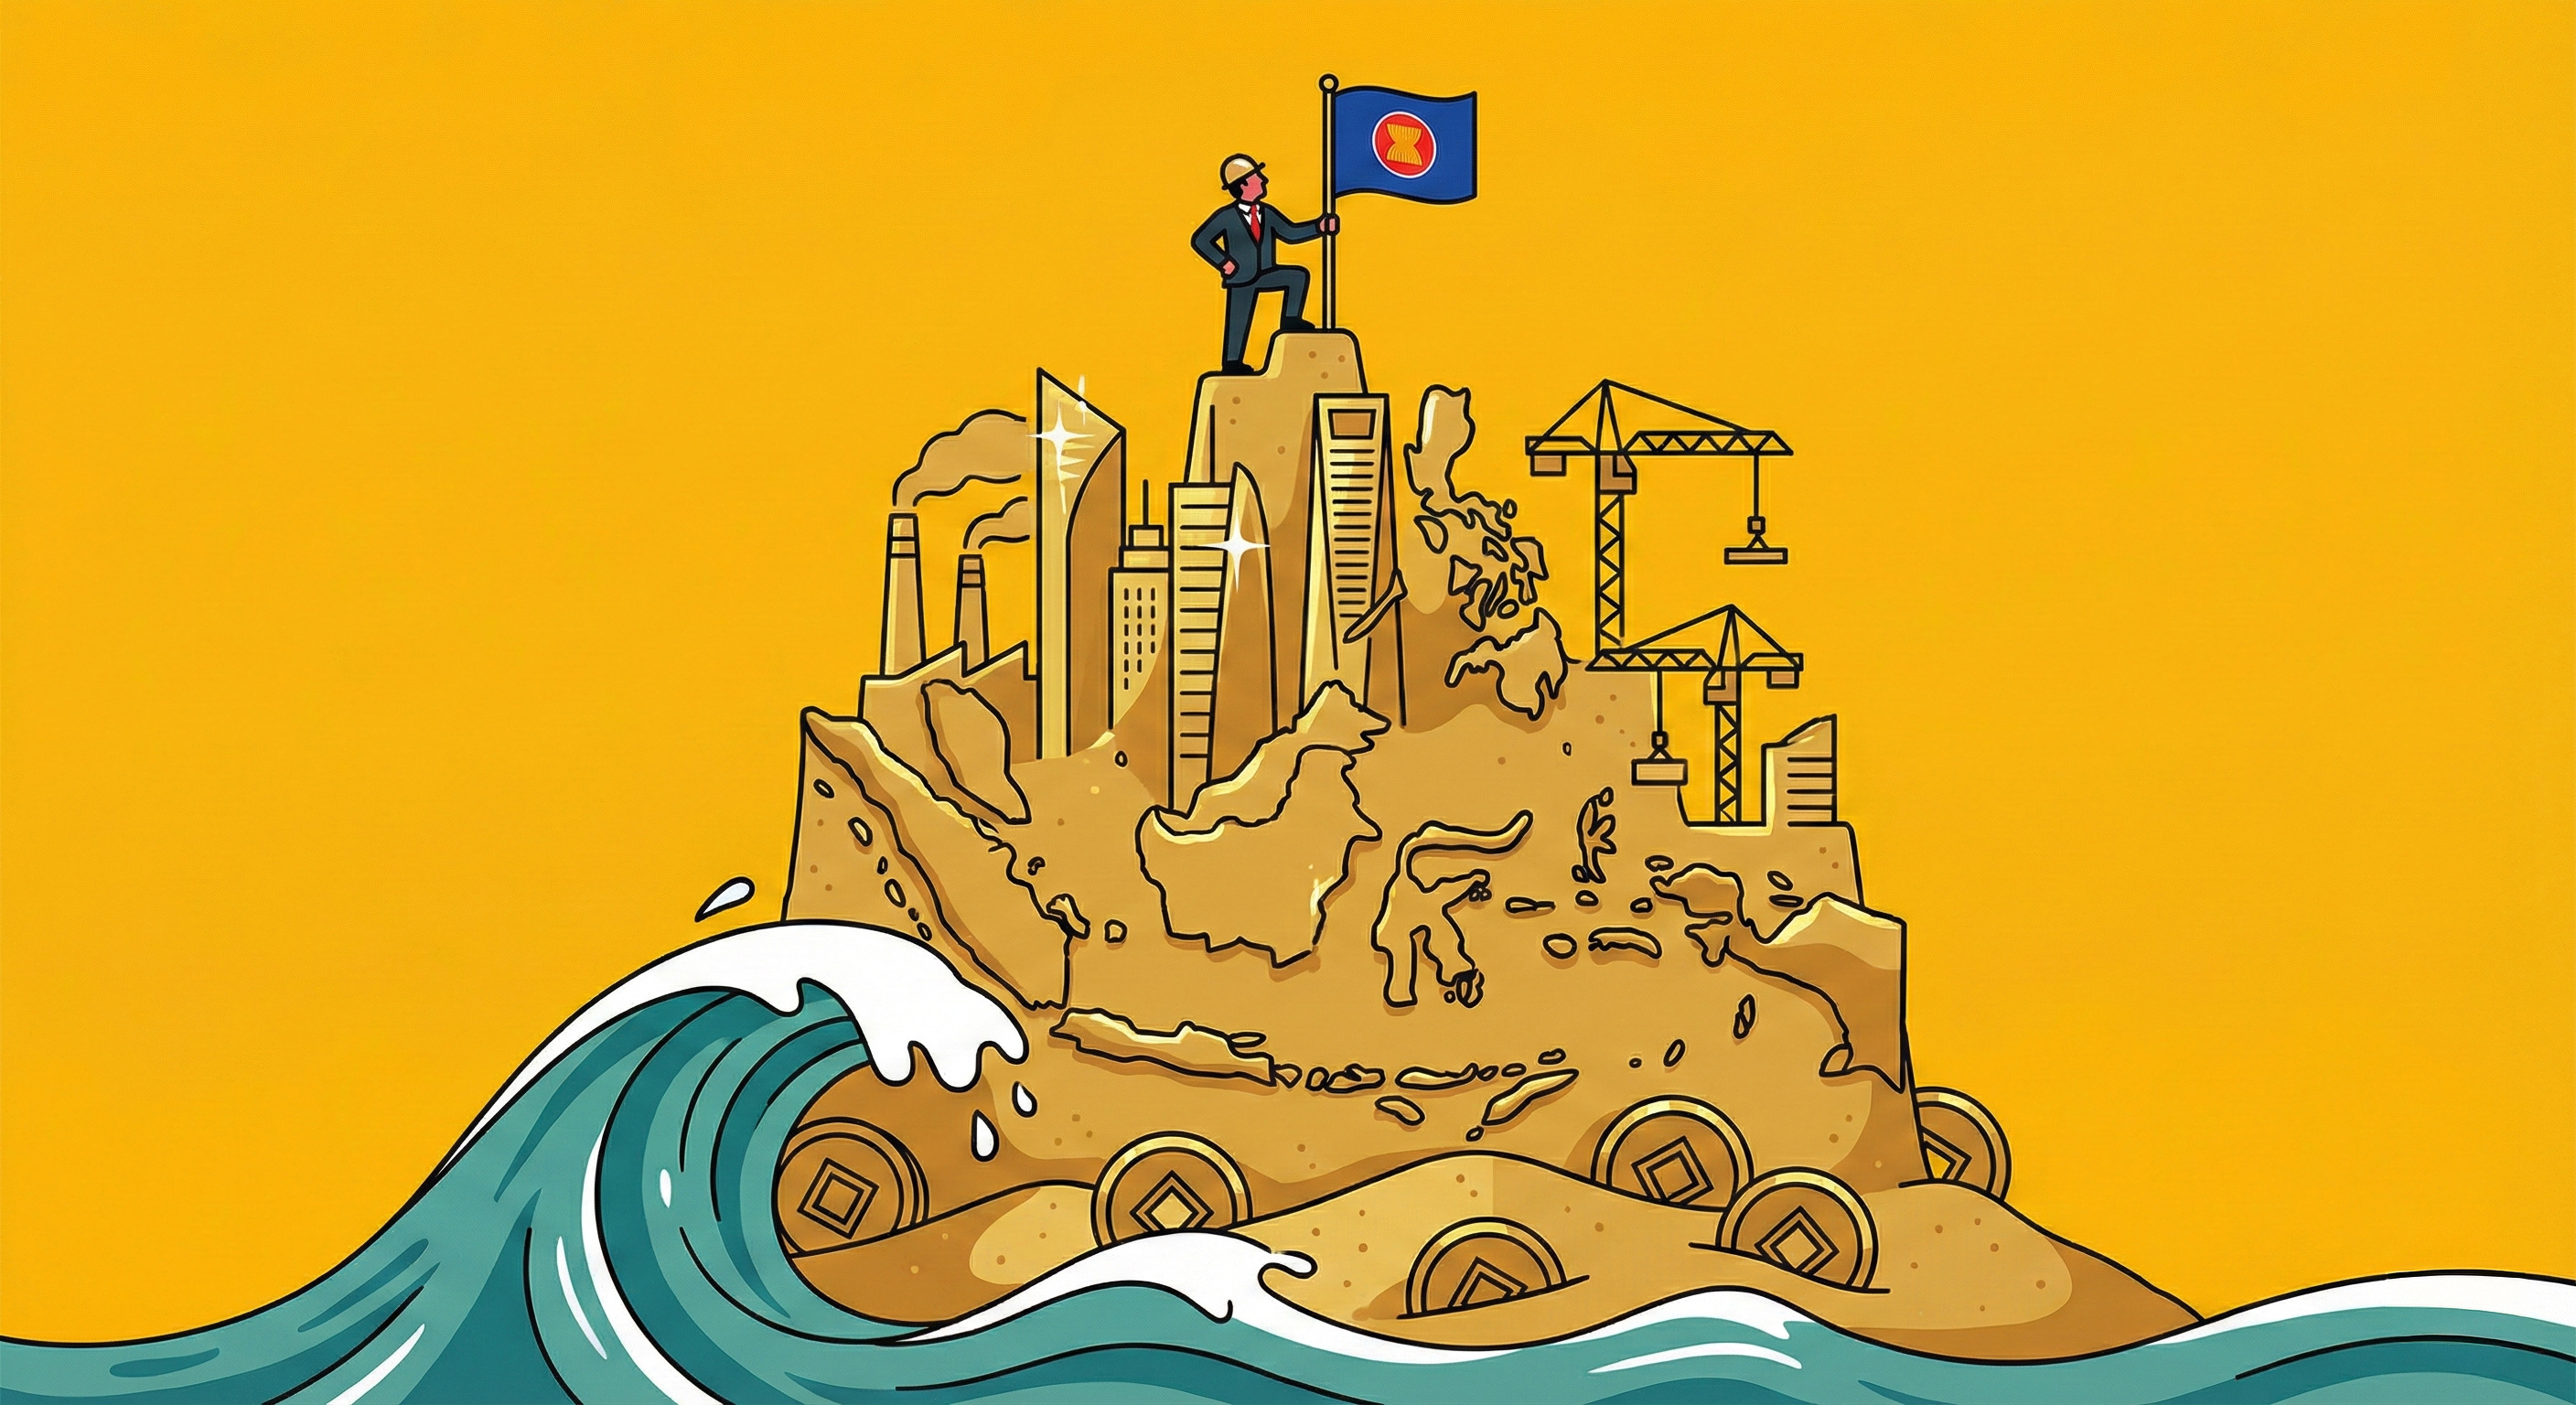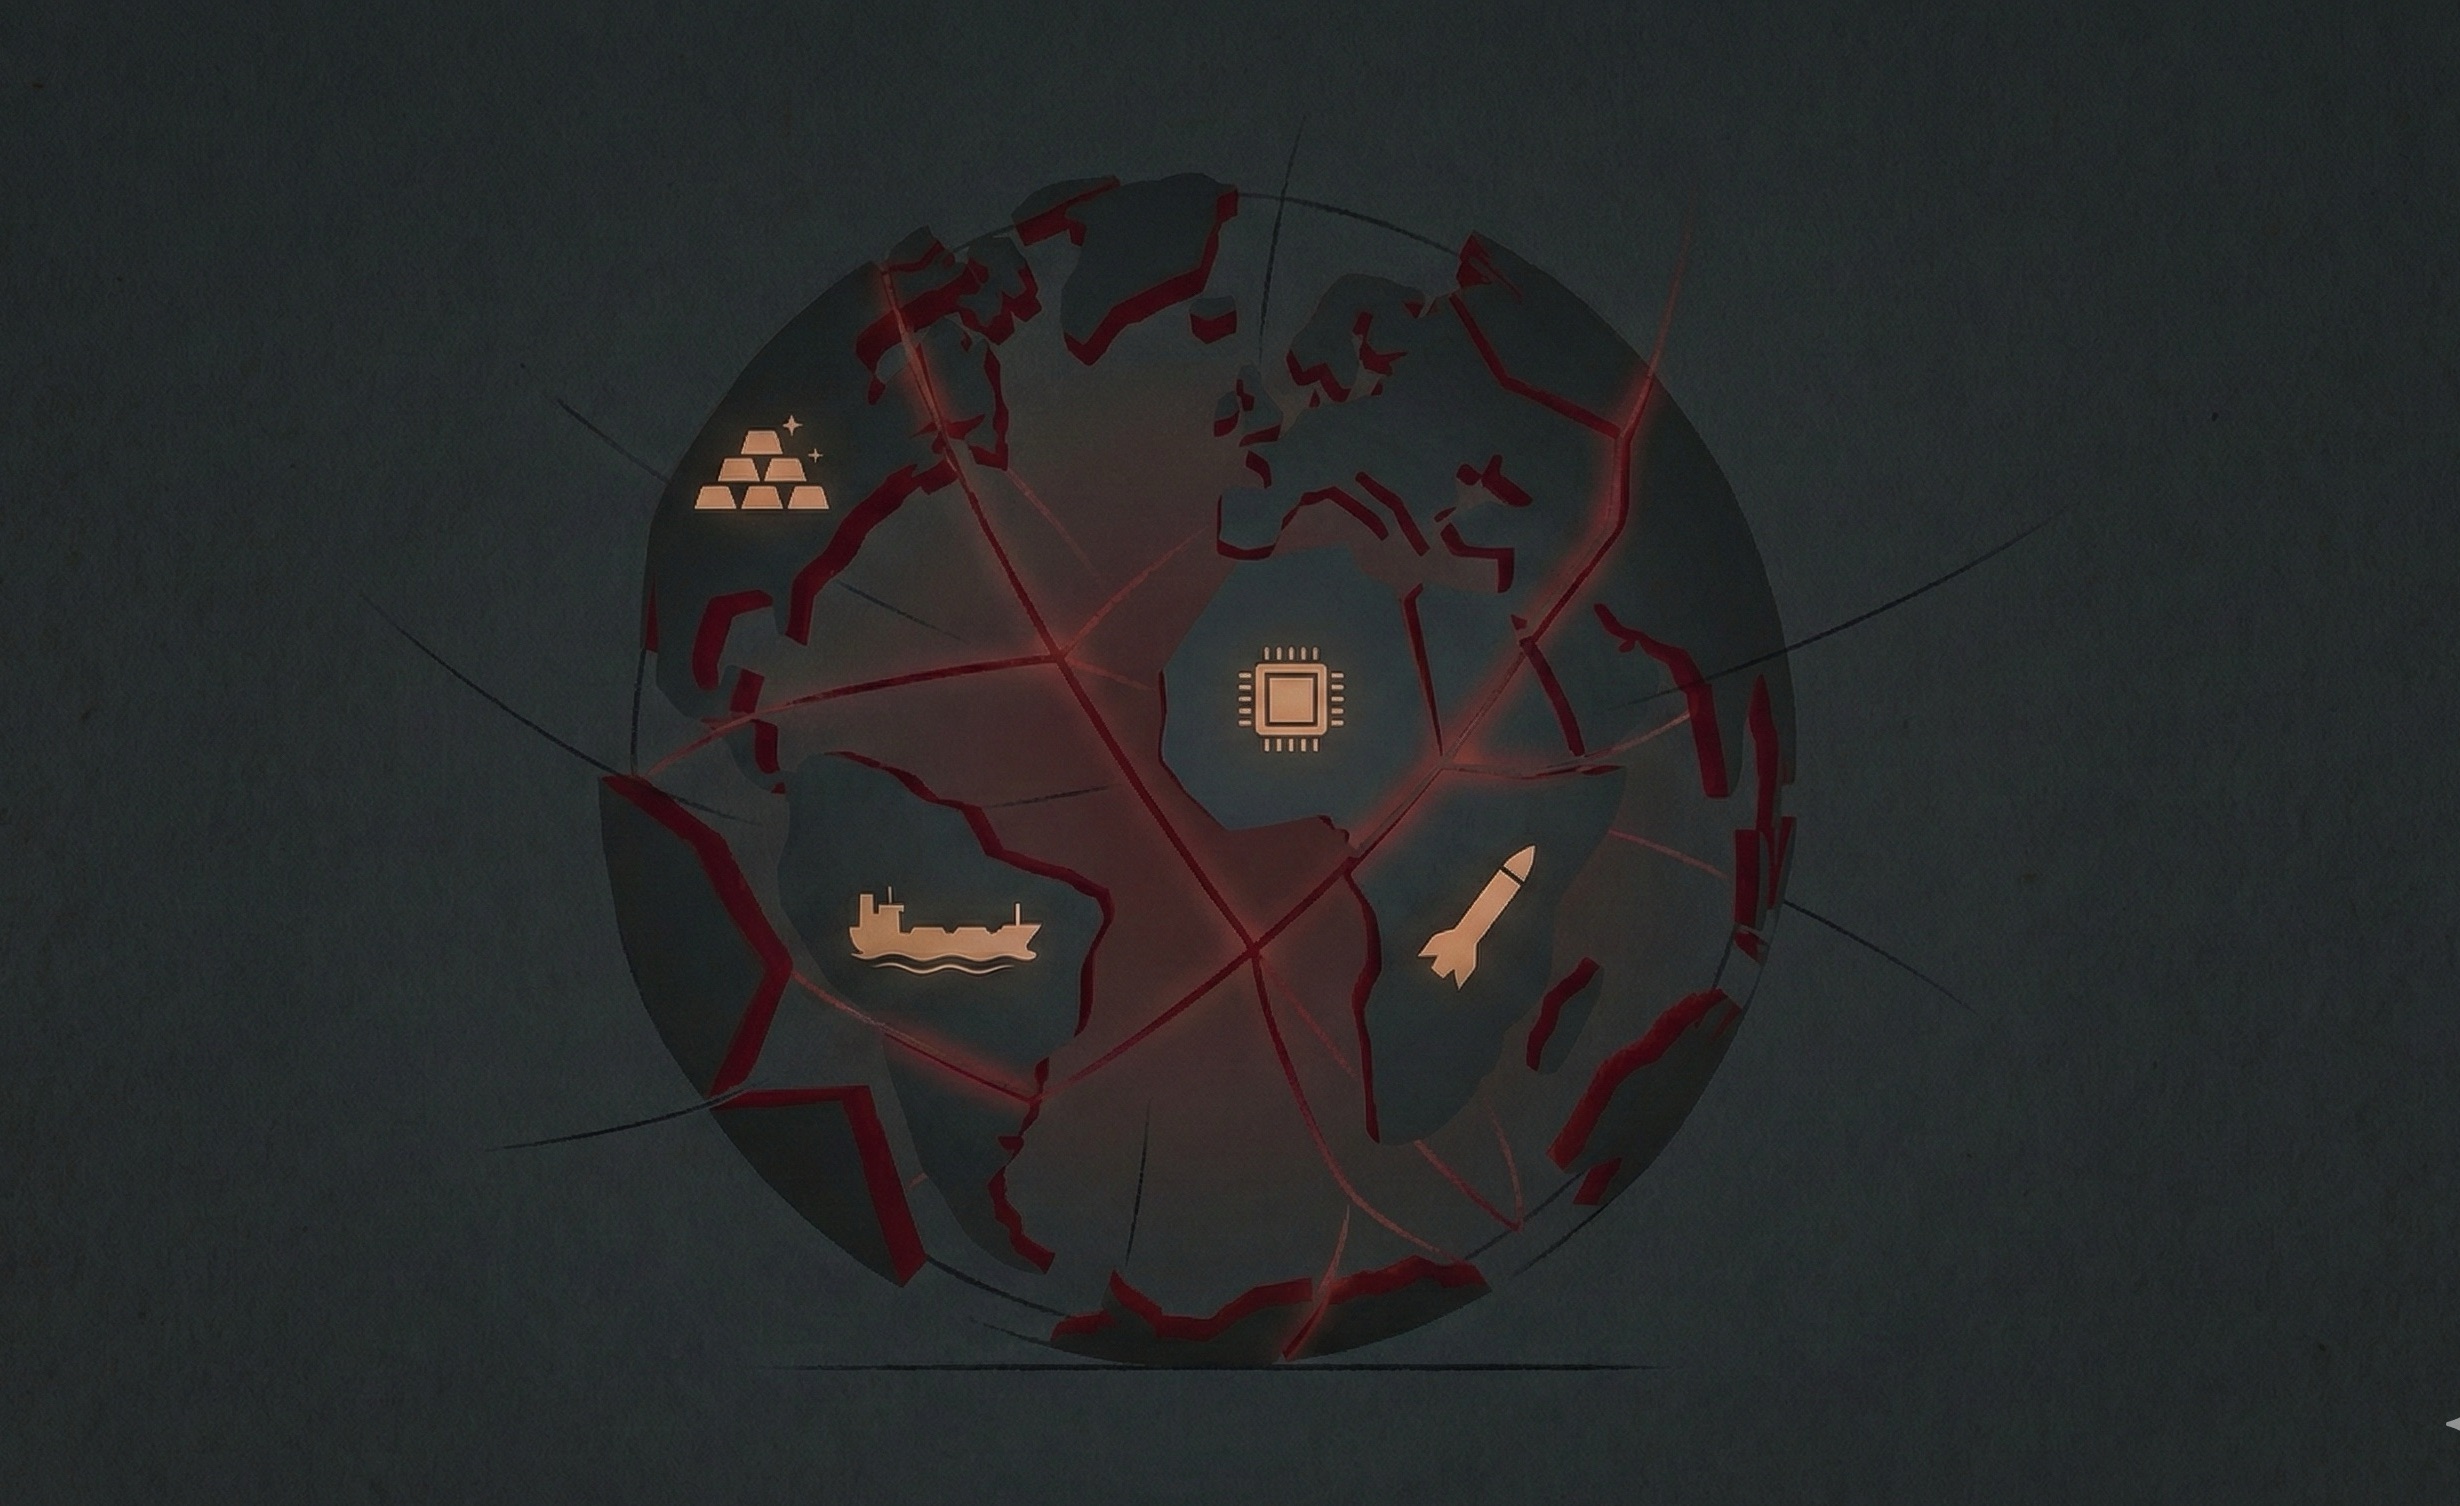
The thesis under investigation — that converging vectors signal an inevitable slide into World War 3 — requires rigorous examination across four dimensions: the "fear gauge" of gold markets, the fragmentation of global trade, the economic exposure of military flashpoints, and the historical parallels to the 1930s.
The evidence shows that while the current geopolitical environment is the most dangerous since the Cold War, several critical structural differences — nuclear deterrence, economic interdependence, and institutional frameworks — create circuit-breakers absent in the pre-WWII period. The risk is not of inevitability but of accident — a miscalculation at one of several powder kegs that could cascade beyond control.
Part I — The "Fear Gauge": Gold vs. Geopolitical Risk
Gold's Record-Breaking Ascent
Gold's trajectory since 2020 tells a story of accelerating geopolitical anxiety. From $1,769/oz at end-2020, the precious metal climbed modestly through 2021–2023 before detonating upward: a 27% gain in 2024 followed by an extraordinary 64% surge in 2025. By late February 2026, spot gold reached approximately $5,278/oz, having touched an all-time high of $5,608 in January 2026.
This is not merely an inflation hedge. The 2025–2026 gold rally has been driven primarily by sustained central bank accumulation, geopolitical hedging by institutional investors, and a structural de-dollarization trend. Western ETF holdings have increased by approximately 500 tonnes since early 2025.
— Goldman Sachs Research, 2026
Central Banks: The Sovereign Signal
Central bank gold buying has been the most telling indicator. After a record 1,136 tonnes purchased in 2022 — the highest since 1967 — official sector buying exceeded 1,000 tonnes for three consecutive years. In 2025, purchases moderated to 863 tonnes, yet this figure remained 82% above the 2010–2021 annual average of 473 tonnes.
China extended its gold-buying spree for 14 consecutive months through December 2024. Poland, Kazakhstan, and Brazil led reported buying in 2025. Gold has overtaken US Treasury notes as a reserve asset by mark-to-market value — the first time in the modern era.
Part II — The Fragmentation: Trade Wars and the "Shift Right"
The Protectionist Surge
The current wave of trade protectionism represents the most significant retreat from globalization since the 1930s. Between 2015 and 2023, the number of new trade restrictions rose sevenfold, from 519 to 3,535 per year. This structural shift mirrors pre-war economic autarky dynamics.
The Political Engine: Right-Wing Populism
The protectionist surge is not an aberration — it is the economic expression of a structural political realignment. In 2024's global "super-election year," right-wing populist parties made gains across virtually every major democracy. The Chapel Hill expert surveys reveal that radical right-wing parties are now more numerous than any other category across 31 democracies surveyed.
Part III — The Powder Kegs: Economic Exposure of Flashpoints
"A simultaneous disruption of both chokepoints would represent the most severe supply shock in modern economic history."
— Geopolitical Risk Report 2026
Strait of Hormuz: The Energy Chokepoint
The Strait of Hormuz facilitates the passage of approximately one-fifth of global oil consumption and one-quarter of total global seaborne oil trade. An estimated 84% of crude oil and 83% of LNG passing through Hormuz goes to Asian markets. Japan imports over 90% of its oil through this strait; South Korea relies on the region for approximately 70% of its crude imports. Taiwan — which imports over 96% of its energy — sources approximately 60% of its oil via Hormuz.
Taiwan Strait: The Silicon Chokepoint
As of 2024, Taiwan produced 60% of the world's semiconductors and 90% of the most advanced chips (sub-5nm). TSMC alone commands a 70.2% share of the global foundry market. Taiwan's semiconductor output reached $165 billion in 2024, representing 20.7% of the island's GDP.
The cruel irony is that Taiwan's energy dependence on the Strait of Hormuz creates a compounding vulnerability: an Iran conflict disrupting Hormuz energy flows would simultaneously threaten Taiwan's ability to manufacture the very chips the world depends on, as the island has only 11 days of natural gas reserves.
Part IV — The Historical Parallel: 1930s vs. 2020s
The Structural Similarities
The Critical Differences
Despite the parallels, the 1930s analogy has important limits. Nuclear deterrence remains the ultimate circuit-breaker: unlike the 1930s, the cost of direct superpower conflict is existential. Economic interdependence is far deeper — global trade represents approximately 30% of GDP versus 9% in 1929. Institutional frameworks — the UN, WTO, IMF — provide conflict-mitigation mechanisms entirely absent in the pre-war period.
China's calculation also differs fundamentally from Imperial Japan's. China is deeply integrated into the global economy and risks catastrophic self-harm from a Taiwan invasion, a consideration that did not apply to Japan's 1930s resource grab.
Milestone Watchlist: 2026
Assessment
Final Assessment
The evidence does not support the thesis of inevitable World War 3. It does support the conclusion that the global system is operating with the lowest margin of safety since 1962. The convergence of active military conflict (Iran, Ukraine), latent flashpoints (Taiwan), structural economic fragmentation (trade wars), and synchronized rearmament creates a system where the probability of cascading escalation is elevated — and rising. Gold at $5,000+ is the market's expression of this assessment: not a prediction of world war, but a pricing of a world where the unthinkable has become thinkable.
Sources: SIPRI (2024 Military Expenditure Report), World Gold Council, Goldman Sachs Research, Global Trade Alert G20 Factbook 2025, CFR, UNCTAD, Caldara & Iacoviello GPR Index, EIA, McKinsey Global Institute, IDS, Metals Focus, Ross Norman projections. All gold price data from Trading Economics and JM Bullion. Political data from Chapel Hill Expert Survey 2024.